 Source: Creative Common/Joe Ross
Before I jump into the meat of this commentary piece, I have to first thank whoever it takes to show my lifelong appreciation for spectacular explosion of Situational Awareness. Led by AI Nostradamus, Leopold Aschenbrenner, this massively over levered ‘hedge fund’ produced returns that were truly mind blowing. I’m still trying to piece together the actual numbers and what I’ve found is a YTD 2026 return of 270% in June. Then a 67% loss in August, and a current YTD of 80%. Assets under management at the time of the implosion were $45 billion levered. I think they might be $5 billion today. Alas, the real Nostradamus.
Source: Creative Common/Joe Ross
Before I jump into the meat of this commentary piece, I have to first thank whoever it takes to show my lifelong appreciation for spectacular explosion of Situational Awareness. Led by AI Nostradamus, Leopold Aschenbrenner, this massively over levered ‘hedge fund’ produced returns that were truly mind blowing. I’m still trying to piece together the actual numbers and what I’ve found is a YTD 2026 return of 270% in June. Then a 67% loss in August, and a current YTD of 80%. Assets under management at the time of the implosion were $45 billion levered. I think they might be $5 billion today. Alas, the real Nostradamus.
 Source: Openverse/Ted Van Pelt
But let me tell you a little secret. An up 80% year when you are quadruple levered isn’t really a 68% Alpha return over the 12% the S&P 500 is giving you. It was 8% of Alpha, with a massive massive massive amount of risk heaped on top. To be clear, you and I could have constructed this guy’s fund of public holding over a pitcher of beers and a combo platter of BBQ, Memphis Hot and Honey Mustard wings at Buffalo Wild Wings. It’s simply not that hard.
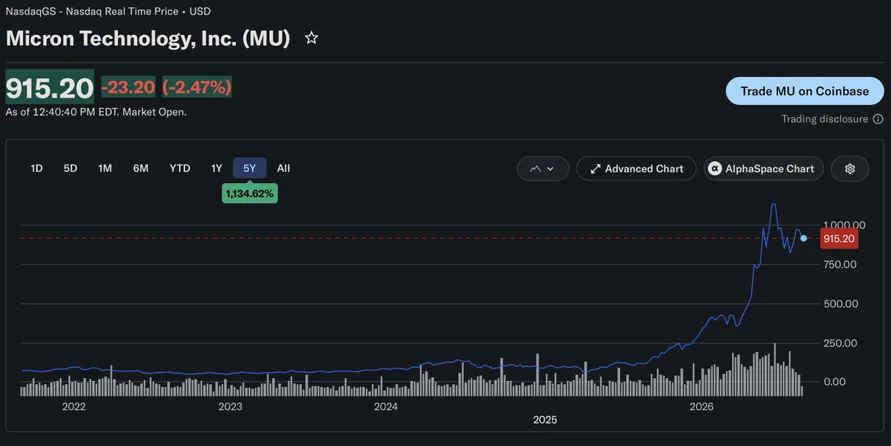
As of June, according to the SEC’s required 13F filing, the fund owned six stocks that made up 82% of the assets under management. Two stocks alone, SanDisk and Micron made up 56.5%. That is not a stock portfolio for a high flying private hedge fund. It’s a PA for anyone who wanted to speculate with some spare dough in a Schwab account.
SanDisk = 28.5% Micron = 28% Bloom Energy = 9.5% Taiwan Semi = 6.4% Nebius = 6.2% Core Weave = 3.7%
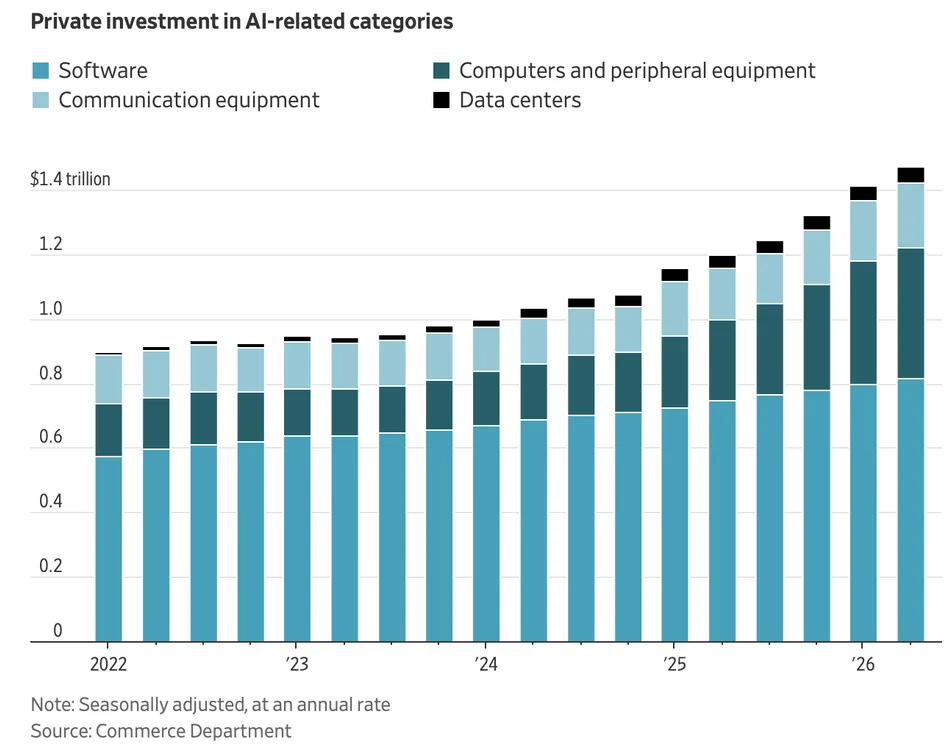
Onward to new things. First off, let’s follow a little dough. There has been a 40% rise in private investment in AI spending in the last two years. And we aren’t talking about $100 billion to $140 billion. We are talking trillions, with an ‘s’.
Source: Openverse/Ted Van Pelt
But let me tell you a little secret. An up 80% year when you are quadruple levered isn’t really a 68% Alpha return over the 12% the S&P 500 is giving you. It was 8% of Alpha, with a massive massive massive amount of risk heaped on top. To be clear, you and I could have constructed this guy’s fund of public holding over a pitcher of beers and a combo platter of BBQ, Memphis Hot and Honey Mustard wings at Buffalo Wild Wings. It’s simply not that hard.
As of June, according to the SEC’s required 13F filing, the fund owned six stocks that made up 82% of the assets under management. Two stocks alone, SanDisk and Micron made up 56.5%. That is not a stock portfolio for a high flying private hedge fund. It’s a PA for anyone who wanted to speculate with some spare dough in a Schwab account.
SanDisk = 28.5% Micron = 28% Bloom Energy = 9.5% Taiwan Semi = 6.4% Nebius = 6.2% Core Weave = 3.7%
Onward to new things. First off, let’s follow a little dough. There has been a 40% rise in private investment in AI spending in the last two years. And we aren’t talking about $100 billion to $140 billion. We are talking trillions, with an ‘s’.
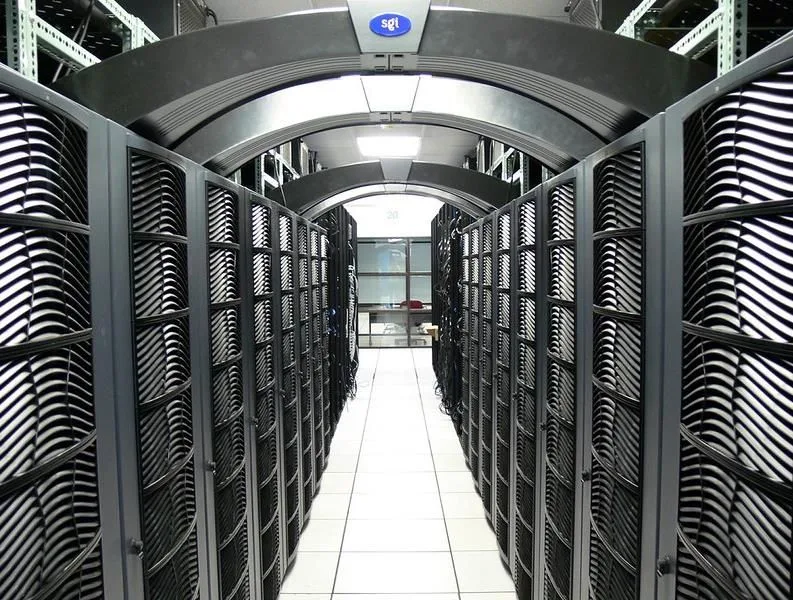
 What sits at the absolute center, is the much-vilified data centers that are being proposed and built everywhere. You’ve seen pics of the outside, now look at the inside.
 Source: Creative Common/Virginia Tech
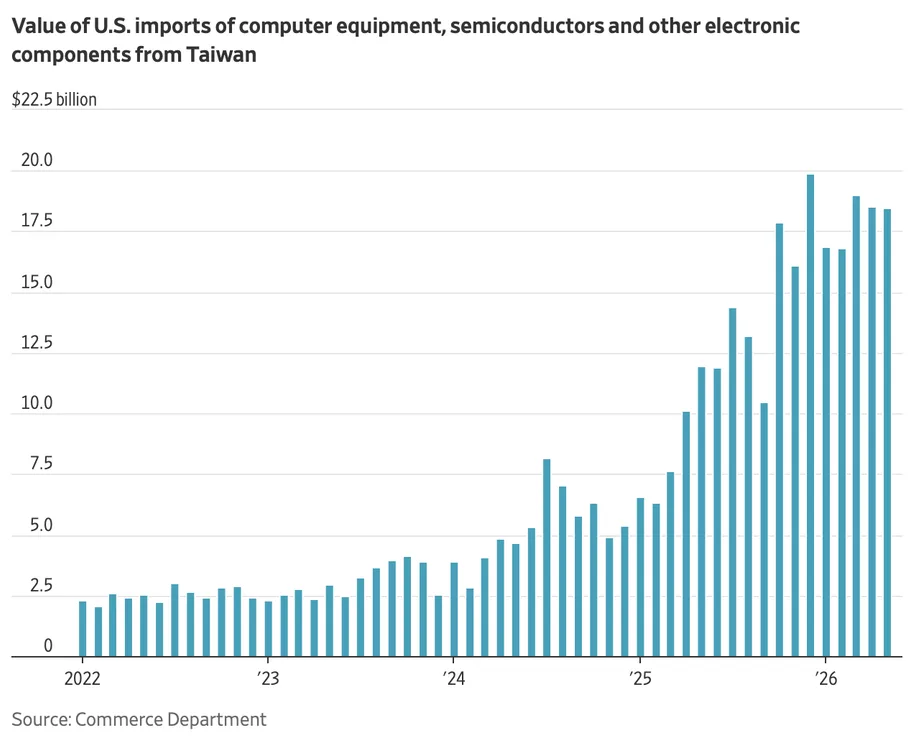
And here is what orders for equipment to outfit them look like. Keep in mind, this is just Taiwan we are talking about here. This image applies to many, if not all, Asian countries with exposure to hardware exports.
Source: Creative Common/Virginia Tech
And here is what orders for equipment to outfit them look like. Keep in mind, this is just Taiwan we are talking about here. This image applies to many, if not all, Asian countries with exposure to hardware exports.
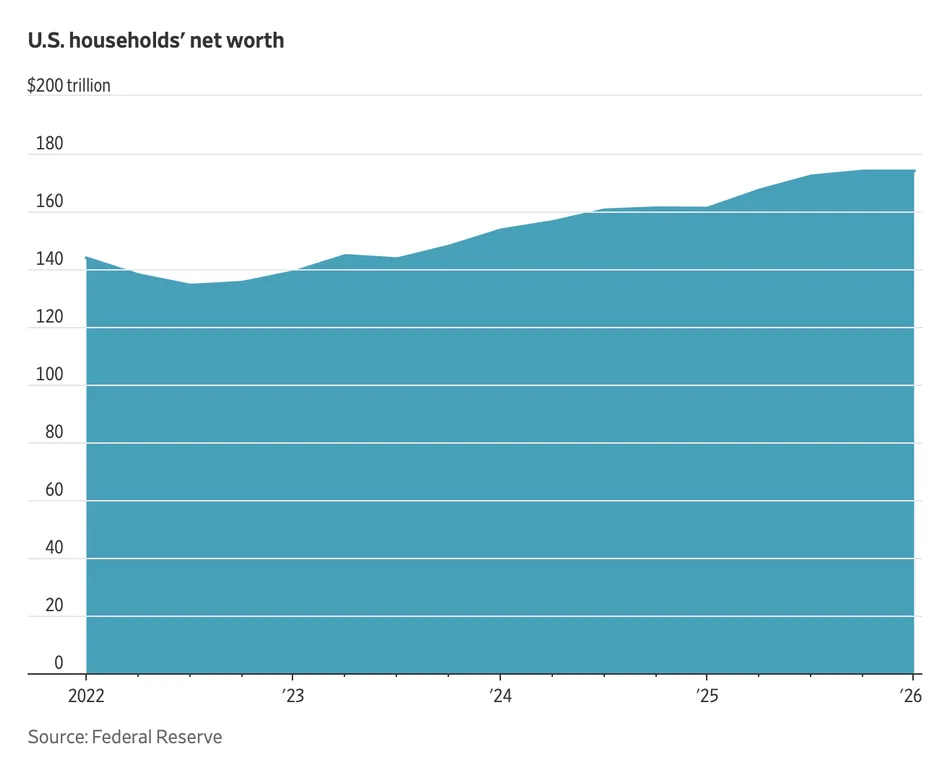
 Net worth is now through the roof, and that has created an uncomfortable layer of insulation. People are on edge about the economy and world affairs, but their stocks and bonds keep pumping out more and more income and wealth. Spend it while you got it? I guess, I don’t have first hand knowledge of such circumstance.
When people’s net worth increases, they spend more freely. Estimates of these wealth effects vary, but economists generally think that for every dollar in stock-market wealth gained, people spend a few cents more. The spending from higher-income consumers, who hold the bulk of stocks, benefits the most.
Net worth is now through the roof, and that has created an uncomfortable layer of insulation. People are on edge about the economy and world affairs, but their stocks and bonds keep pumping out more and more income and wealth. Spend it while you got it? I guess, I don’t have first hand knowledge of such circumstance.
When people’s net worth increases, they spend more freely. Estimates of these wealth effects vary, but economists generally think that for every dollar in stock-market wealth gained, people spend a few cents more. The spending from higher-income consumers, who hold the bulk of stocks, benefits the most.
 Source: Federal Reserve
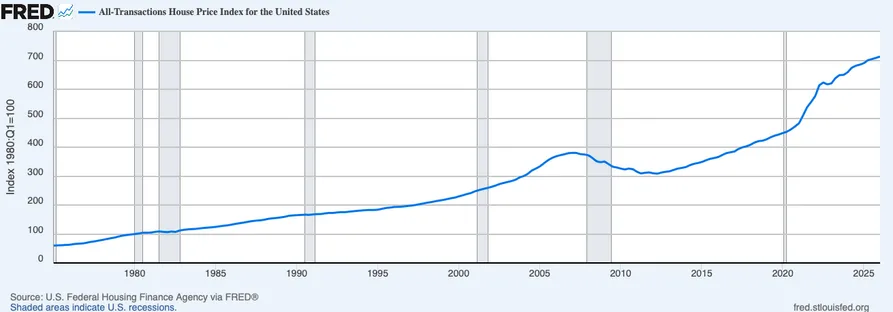
And don’t forget this structural bubble that we will be dealing with for the next decade, or more. And we only have ourselves, and the peoples who work in the Eccles building in D.C., to take responsibility. We did it to ourselves.
Source: Federal Reserve
And don’t forget this structural bubble that we will be dealing with for the next decade, or more. And we only have ourselves, and the peoples who work in the Eccles building in D.C., to take responsibility. We did it to ourselves.
 With that as prelude, please come join me as we dive down deep into the rabbit hole of intellectual curiosity and the quest for knowledge. Too much? Not even close given the world we are dealing with today. As the man who taught me how to fly fish in the late 80s would say when things started to go upside down, ‘Life isn’t all popcorn and beer farts!’ And that was just one of John Tubbesing’s many a great saying.
 Source: Bryan Goligoski
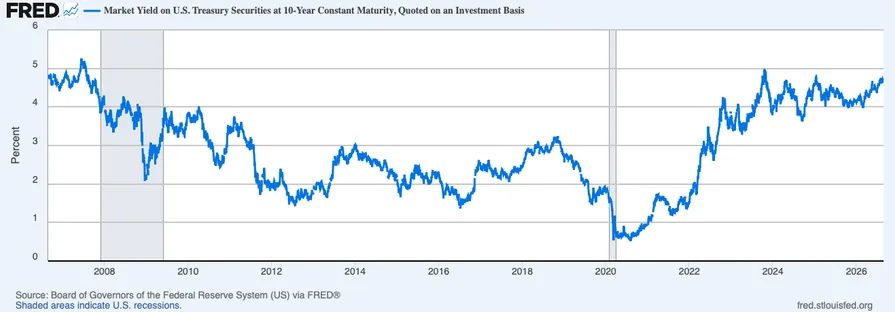
In fixed income and government bonds, a funny thing happened to ‘lower for longer’ in the market. Yield on the 10-year treasury just traded to 4.70%. I didn’t think much of it because it had traded 4.88% three years ago in 2023. Then I realized that these levels are the ones we were trading at almost 20 years ago.
Source: Bryan Goligoski
In fixed income and government bonds, a funny thing happened to ‘lower for longer’ in the market. Yield on the 10-year treasury just traded to 4.70%. I didn’t think much of it because it had traded 4.88% three years ago in 2023. Then I realized that these levels are the ones we were trading at almost 20 years ago.
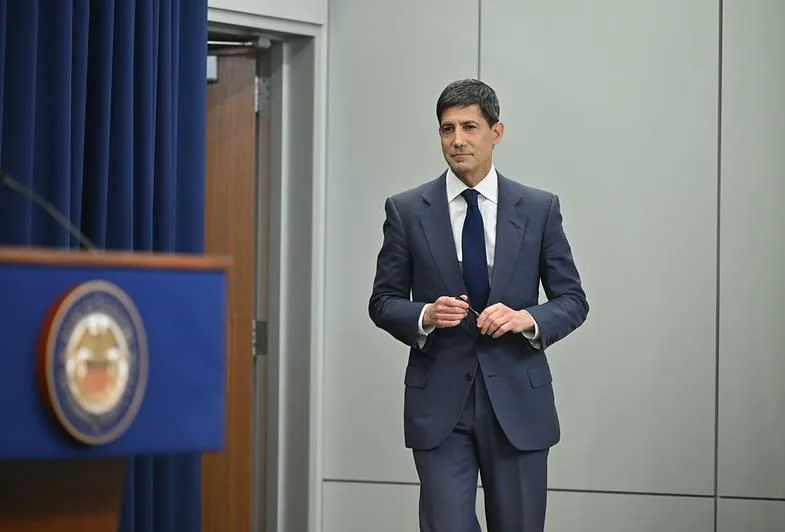
 So why is this time more important? Because newly seated Fed Chair Kevin Warsh is getting a quick face slapping. If he had any intention of lowering the fed funds rate anytime soon, the case isn’t there now. And the WSJ went with the headline ‘Kevin Warsh asked the market to speak. And it did.’ That being said, he looks good in a suit.
 Source: Federal Reserve
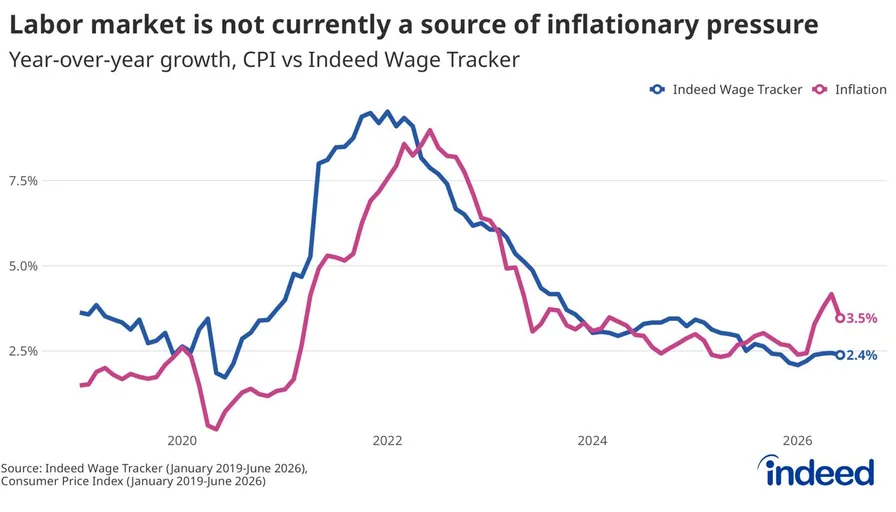
Let me say once more, you myopians at the Fed are holding too close to the 2% target for inflation. That’s all fine and good in normal times, but normal times these are not. You probably can’t do it coming off three years of CPI north of 5%. With a fat 12 months above 8%. Inflation needs to go negative, otherwise it’s just growing at a lower rate. Why do you think the squeeze is on from the gas pump to the checkout line?
Source: Federal Reserve
Let me say once more, you myopians at the Fed are holding too close to the 2% target for inflation. That’s all fine and good in normal times, but normal times these are not. You probably can’t do it coming off three years of CPI north of 5%. With a fat 12 months above 8%. Inflation needs to go negative, otherwise it’s just growing at a lower rate. Why do you think the squeeze is on from the gas pump to the checkout line?
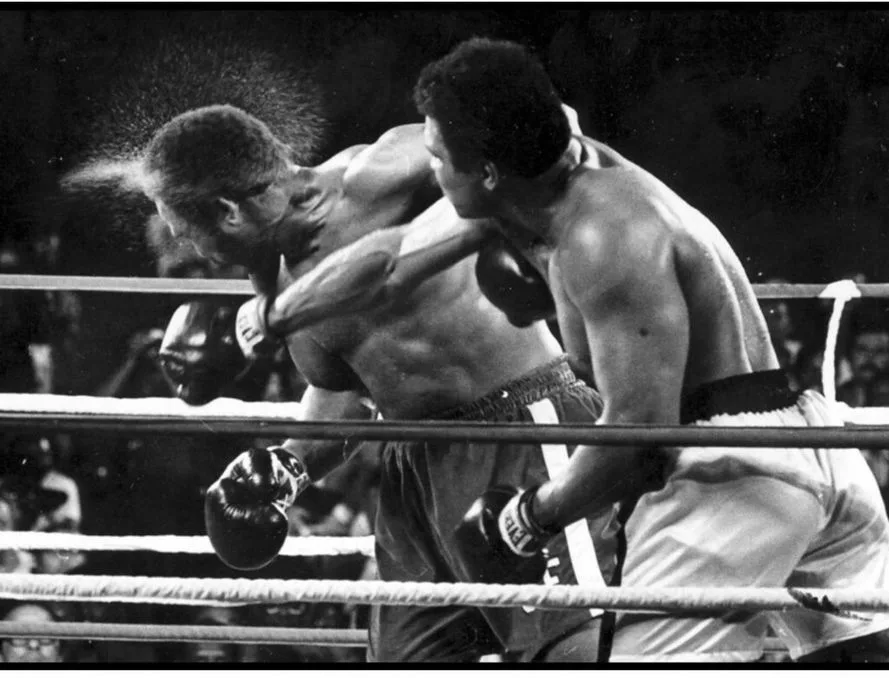
 The wildcard in all of this comes from the Department of Treasury where Scott Bessent, the current Treasury Secretary, just unleashed the almost unthinkable. He announced a plan to start buying treasury securities to drive interest rates lower. That’s the program. It’s not about liquidity; it’s about putting a firehose on a rising rates dumpster fire. Donald Trump would like lower interest rates for the next three months. He has already intimated that Treasury has almost unlimited power to spend. If there was ever a bond market fight, this is of the heavyweight kind the likes of which have not been seen since Ali v. Foreman. Remember, everyone has a plan until they get punched in the face.
 Source: Flickr/Black & White
Onward to the wonderful world of stocks and the markets. I want to once again point out that the S&P 500 is not the economy. In fact, 28% of it is a giant AI/technology trade. So, when you hear the breathless panting about how we have set new records on the market, keep in mind of what that underlying market looks like. NVIDIA = 8% Apple = 7% Alhphabet/Google = 6% Microsoft = 5% Amazon = 4% Broadcom = 3% Meta = 3% Tesla = 2% Total Weighing = 38% And here is what that absolute beast of combination of stocks has done over the past ten years. A near quadrupling of your money over a single decade. Great trade, assuming you never sold.
Source: Flickr/Black & White
Onward to the wonderful world of stocks and the markets. I want to once again point out that the S&P 500 is not the economy. In fact, 28% of it is a giant AI/technology trade. So, when you hear the breathless panting about how we have set new records on the market, keep in mind of what that underlying market looks like. NVIDIA = 8% Apple = 7% Alhphabet/Google = 6% Microsoft = 5% Amazon = 4% Broadcom = 3% Meta = 3% Tesla = 2% Total Weighing = 38% And here is what that absolute beast of combination of stocks has done over the past ten years. A near quadrupling of your money over a single decade. Great trade, assuming you never sold.
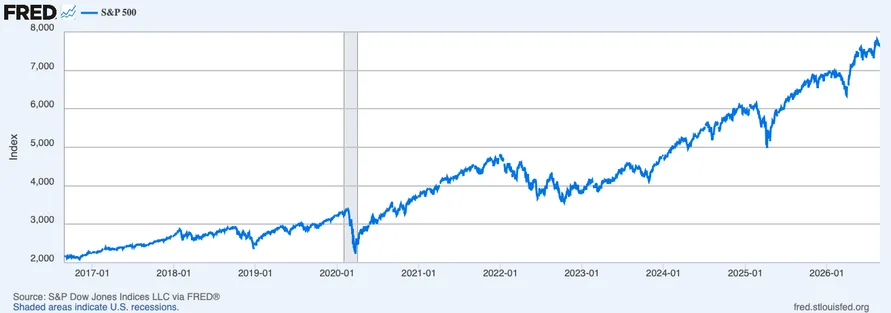 Past five years haven’t been bad either, assuming a doubling of your dough is considered ‘not bad’. But keep in mind you perma bulls, the S&P 500 did trade sideways for three of those five years. I’m just sayin!
 Source: Yahoo Finance!
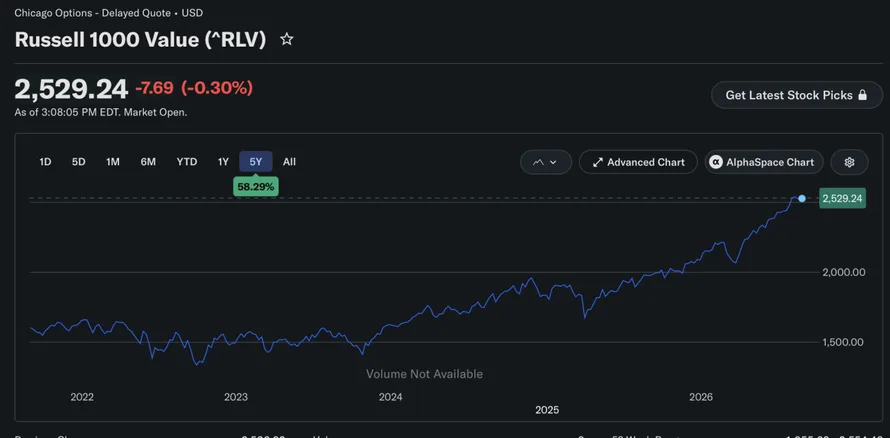
I think it’s a good thing for the overall market because it lets some steam off. When other companies can pick up the slack and the leadership broadens out, it can suggest we are good in other places as well. This is the Russell 1000 value index. While it’s trailing, up 50% is still a solid return.
Source: Yahoo Finance!
I think it’s a good thing for the overall market because it lets some steam off. When other companies can pick up the slack and the leadership broadens out, it can suggest we are good in other places as well. This is the Russell 1000 value index. While it’s trailing, up 50% is still a solid return.
 Source: Yahoo Finance!
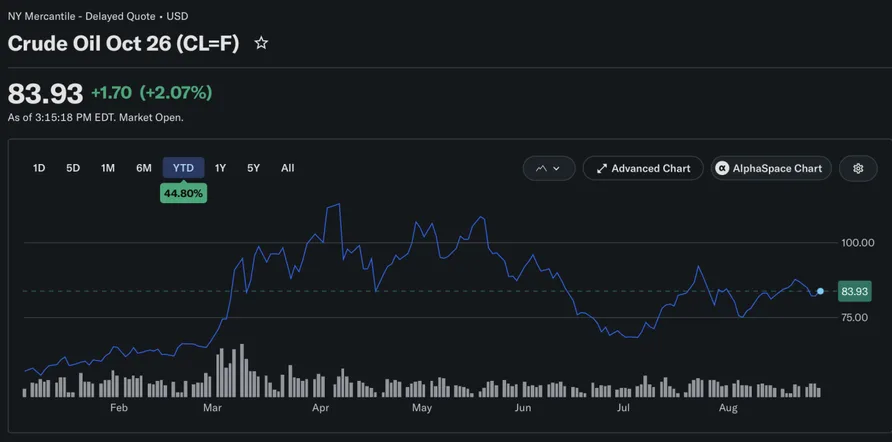
In my mind the pressure is building in terms of global theatrics and the United States is leading the charge. I don’t think the vast unwashed masses in this country can take more rounds of higher fuel prices. Prices that are elevated due to a ‘war’ that doesn’t seem very ‘warlike’. And that’s just the start of it all. I don’t think any of us really signed up for this. An almost 45% year to date rise in the world’s most important commodity is not something that was expected going in. And now the Iranian’s have control of Hormuz? Ouch!
Source: Yahoo Finance!
In my mind the pressure is building in terms of global theatrics and the United States is leading the charge. I don’t think the vast unwashed masses in this country can take more rounds of higher fuel prices. Prices that are elevated due to a ‘war’ that doesn’t seem very ‘warlike’. And that’s just the start of it all. I don’t think any of us really signed up for this. An almost 45% year to date rise in the world’s most important commodity is not something that was expected going in. And now the Iranian’s have control of Hormuz? Ouch!
 Source: Yahoo Finance!
People get elected and sometimes peace follows, and sometimes chaos does. About a week ago when my mother and I were marinating ice cubes in the backyard I said this….’I think people could take AI, or they could take the chaos in D.C., but they couldn’t take both.’ That’s a lot for the comfort blanket of assets and portfolio values to absorb. May you all feel that warm swaddle from time to time. Let it take you back to an easier time in life. Just make sure to wear a proper diaper.
Source: Yahoo Finance!
People get elected and sometimes peace follows, and sometimes chaos does. About a week ago when my mother and I were marinating ice cubes in the backyard I said this….’I think people could take AI, or they could take the chaos in D.C., but they couldn’t take both.’ That’s a lot for the comfort blanket of assets and portfolio values to absorb. May you all feel that warm swaddle from time to time. Let it take you back to an easier time in life. Just make sure to wear a proper diaper.